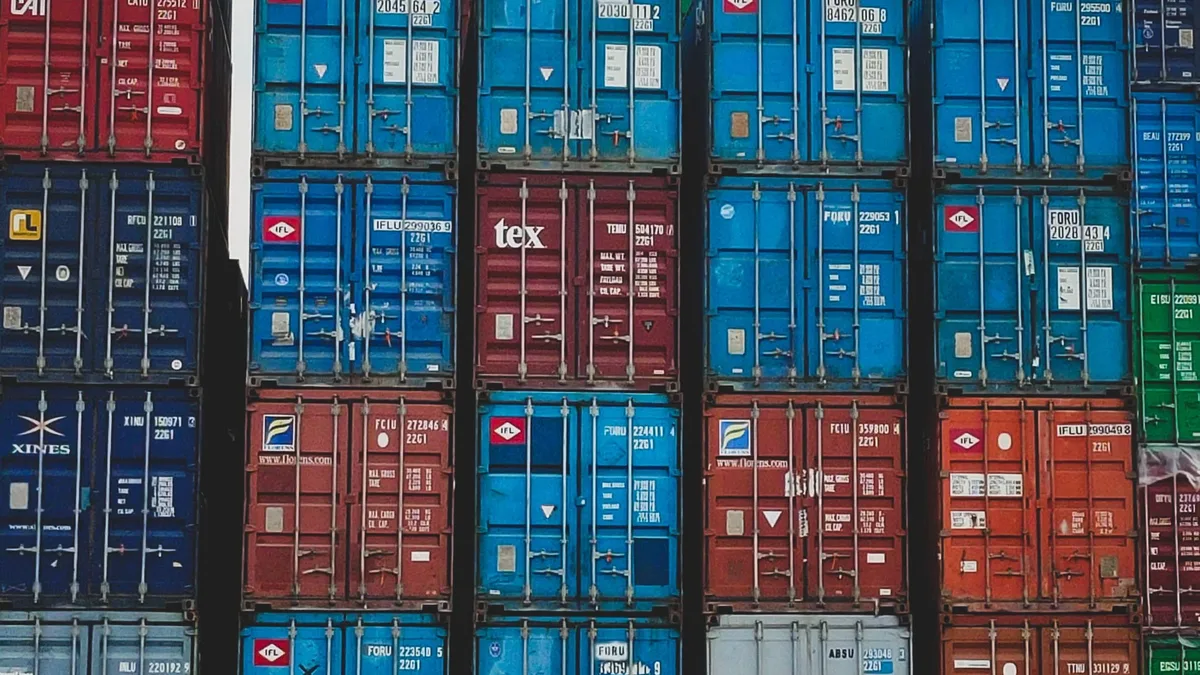
Global container volumes hit record 17.3 million TEUs
World container throughput reached a new monthly high of 17.3 million TEUs in July 2026, with year-to-date volumes up 5.1%.
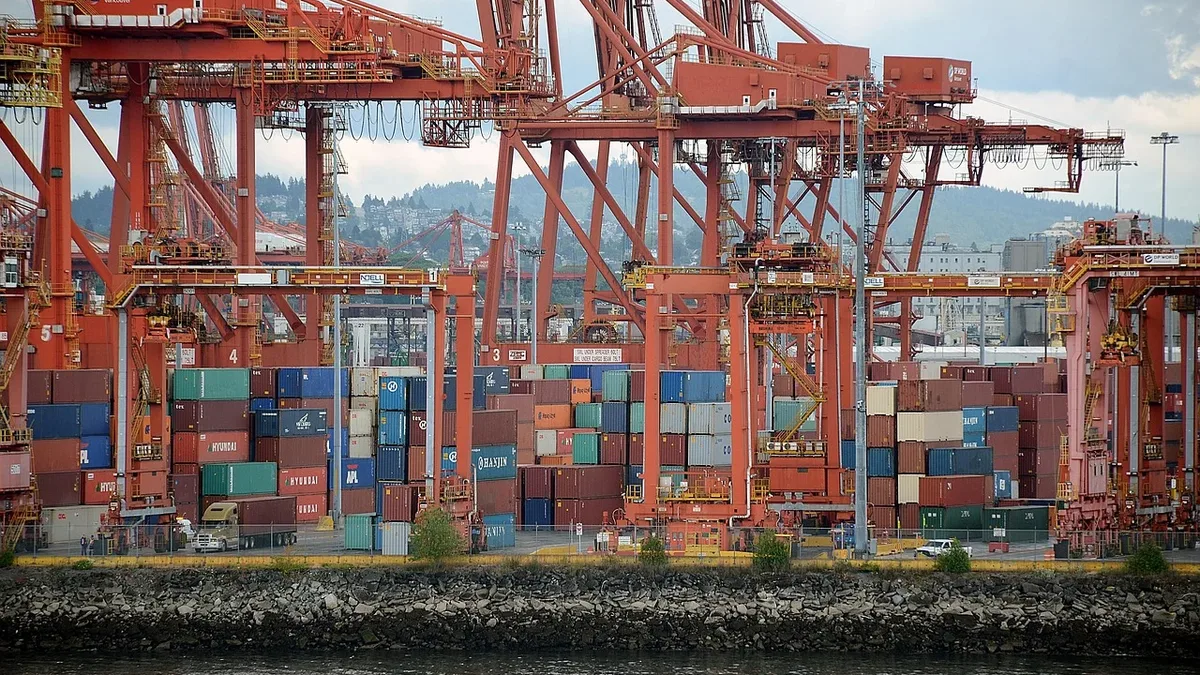
Global container throughput set a new monthly record in July 2026, reaching 17.3 million twenty-foot equivalent units (TEUs). Revised data from Container Trade Statistics shows this figure is roughly 25,000 TEUs above the previous high set in May 2026.
Year-to-date global volumes through July are 5.1% higher than the same period in 2025. The month of July alone saw a 4.5% increase compared to July 2025.
Freight rates reach two-year high
The CTS Global Price Index climbed to 115 points in July 2026. This marks a 7-point increase from June and a 47% rise since the start of the year. Compared to July 2025, the index is now 37% higher.
Its steep upward trajectory began in February 2026 alongside the onset of the Persian Gulf crisis. The last time the index reached similar levels was in August 2024.
Regional import trends show divergence
Through the first seven months of 2026, most major regions recorded import growth. The Indian Sub-Continent & Middle East was the exception, with a 4.2% year-to-date decline.
Sub-Saharan Africa posted the strongest percentage gain at 14%. This was driven in part by Asia-origin cargo, which added nearly 700,000 TEUs versus 2025. Imports from North America to Sub-Saharan Africa also rose almost 15% year to date.
Europe's imports were up 6.1% year to date. Far East cargo contributed roughly 1.5 million additional TEUs compared with the prior year. One factor behind this strength may be growing European demand for Chinese-manufactured vehicles, with some shipments shifting into containers.
Export patterns highlight Asia's strength
On the export side, Asia posted the strongest growth, up nearly 9% year to date. This represents almost 6 million additional TEUs, with gains to every destination region. Contributions from Europe and Sub-Saharan Africa were particularly strong.
The Indian Sub-Continent & Middle East recorded the largest year-to-date export decline at 8.5%. Europe's exports slipped 0.7%. Europe's weaker export performance reflects limited growth to most destinations, though Sub-Saharan Africa was an exception.
Exports from Europe to the Indian Sub-Continent & Middle East fell by more than 10% year to date. This widens the gap between Europe's strong imports and softer exports.
| Region | Year-to-Date Import Change | Year-to-Date Export Change |
|---|---|---|
| Sub-Saharan Africa | +14% | Data Not Specified |
| Europe | +6.1% | -0.7% |
| Indian Sub-Continent & Middle East | -4.2% | -8.5% |
| Asia | Data Not Specified | +9% |
The data illustrates strong container volumes alongside sharply rising freight costs. Market disruption is pushing rates higher even as trade flows remain strong.