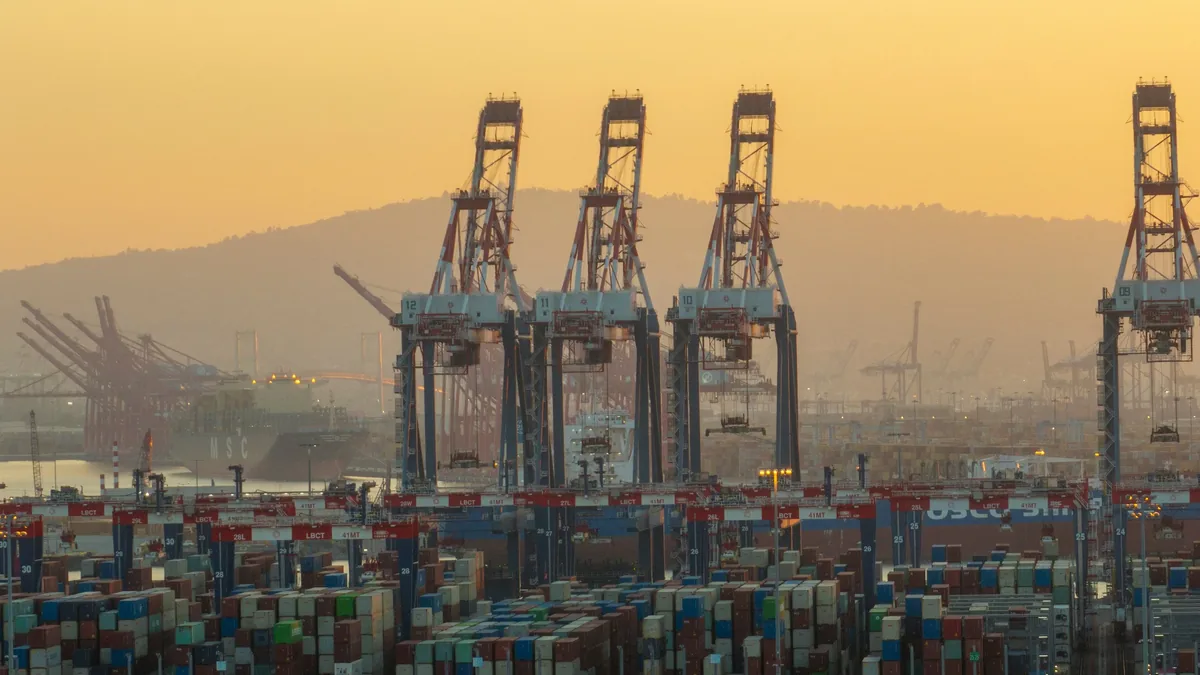
Major Asian Container Ports And Their Throughput
| Original use | Deep-water container transshipment and gateway port |
|---|
Origin and history
The concept of tracking and ranking major Asian container ports by their throughput emerged from the global containerization revolution that began in the mid-20th century. This specific analytical focus developed as Asia's economic power grew, with the need for standardized comparison becoming critical for shipping lines, logistics firms, and economists. The systematic, regular publication of such rankings and data is largely a function of the late 20th and early 21st centuries, coinciding with the digital era of trade data aggregation. Organizations like the United Nations Conference on Trade and Development (UNCTAD) and global port authorities' associations began formalizing this data collection in the 1980s and 1990s. The rise of China as a manufacturing hub in the 1990s fundamentally shifted the geographic focus and scale of these rankings. Today, entities like Lloyd's List, Alphaliner, and national port associations provide the stable, widely-established figures that constitute this reference topic.
What it is for
This data serves as a primary indicator of regional and global economic health, reflecting manufacturing output, consumer demand, and the flow of intermediate goods. Shipping lines and alliance networks use throughput figures to plan vessel deployment, design service routes, and prioritize port calls on major trade lanes. Port authorities and terminal operators utilize comparative throughput data for strategic planning, capital investment justification, and benchmarking their performance against regional competitors. Governments and trade policymakers analyze these figures to assess the effectiveness of infrastructure spending, trade agreements, and economic policies on commercial activity. Investors and analysts in the transportation and logistics sectors rely on throughput trends to evaluate the financial stability and growth potential of port-related equities and infrastructure funds. For importers and exporters, understanding which ports handle the highest volumes informs decisions about supply chain routing, potential congestion points, and overall transit time reliability.
Overview
The list of major Asian container ports is dominated by facilities in East and Southeast Asia, reflecting the region's role as the world's primary manufacturing center. Throughput is measured in twenty-foot equivalent units (TEUs), representing the number of standard 20-foot containers a port handles in a given year, including both loaded and empty units. The rankings are dynamic, with positions shifting annually based on economic conditions, infrastructure expansions, and changes in trade patterns. Chinese ports, led by Shanghai and Ningbo-Zhoushan, consistently occupy the top global positions, handling volumes that often exceed the combined throughput of many continental regions. Other consistently high-volume Asian hubs include Singapore, a major transshipment nexus, and South Korea's Busan, a key Northeast Asian gateway. Significant secondary tiers include ports in Malaysia, Taiwan, Thailand, and Vietnam, each serving crucial roles in regional and global supply chains.
What to know
Throughput figures alone do not indicate a port's efficiency, profitability, or service quality, as they can be inflated by the handling of empty containers or domestic transshipment. The distinction between gateway ports, which serve a local hinterland, and transshipment hubs, which redistribute containers between vessels, is critical for interpreting the economic impact of the throughput. Infrastructure capabilities, such as water depth, crane technology, and landside connectivity, are more important operational details than raw volume for logistics planners. Data reporting standards can vary, with some ports reporting gross throughput including empties and domestic traffic, while others may use different methodologies, complicating direct comparison. Political and trade policy shifts, such as tariff changes or regional trade agreements, can rapidly alter cargo flows and thus a port's throughput ranking from one year to the next. Labor relations, automation levels, and vulnerability to climatic events are practical operational factors not revealed by annual TEU statistics but are essential for risk assessment.
Common questions
A common question is which port is currently the busiest in Asia, a title historically contested between Shanghai and Singapore, though Shanghai has held the top position globally since the 2010s. Many ask how throughput is calculated, which involves a count of every container movement across the quay, meaning a single container transferred from a ship to a barge and then to another ship may be counted twice. People often inquire why certain large countries have lower-ranking ports, which typically relates to factors like infrastructure development, trade balance, or the geographic distribution of industrial centers away from the coast. A frequent question concerns the impact of major global events, such as pandemics or trade disputes, on throughput, which can cause significant volatility and rerouting of cargo flows. Users commonly seek to understand the difference between port throughput and port capacity, where capacity is the theoretical maximum a port can handle, while throughput is the actual volume achieved. Many wonder if high throughput correlates with congestion, which is not inherently true, as efficient ports can move high volumes smoothly, whereas others with less robust infrastructure may experience delays at lower levels.
Pros and cons
A primary pro of focusing on high-throughput ports is their extensive connectivity, offering a greater frequency of direct sailings to global destinations, which reduces transit times and increases supply chain options. These ports typically have deeper investment in advanced cargo-handling equipment and technology, leading to faster vessel turnaround times and better data visibility for shippers. A significant con is that their very popularity can lead to severe congestion during peak seasons or operational disruptions, causing widespread schedule reliability issues across entire ocean carrier networks. The scale of operations can sometimes depersonalize service, with larger ports being less flexible for special requests or niche cargo compared to smaller, specialized terminals. A common mistake is assuming the largest port is always the best routing choice, often overlooking nearer mid-sized ports that may offer cheaper rates, less congestion, and adequate service for a specific cargo's destination. Importers who blindly route all cargo through the top-ranked port often regret it when faced with unpredictable demurrage and detention charges due to systemic delays, whereas those using regional alternatives may achieve more consistent total landed costs.
Who it suits
This data and the ports listed suit global shipping lines and vessel alliance planners who must deploy ultra-large container vessels efficiently, requiring ports with the infrastructure to handle such ships and the volume to fill them. It suits multinational manufacturers and large-scale importers/exporters whose supply chains are built on economies of scale and who require frequent, direct service on major East-West trade lanes. Economists, market researchers, and infrastructure investors use this data for macro-level analysis of trade flows, regional economic growth, and for making long-term capital allocation decisions. National governments and port authorities in developing regions utilize these rankings to benchmark their own development goals and to justify investments aimed at capturing a share of container traffic. It is less immediately critical for small-to-medium enterprises shipping less-than-container-load (LCL) cargo, who are often better served by freight forwarders optimizing for total cost and speed through secondary gateways. The data is also essential for logistics software developers and supply chain visibility platforms, which integrate port throughput and performance metrics to build predictive analytics and routing algorithms for their users.
Latest Major Asian Container Ports And Their Throughput news
Latest reporting

Global container shipping reliability falls to 29% in August
Schedule reliability for global container shipping dropped to 29% in August, with average delays rising to 5.1 days, according to analyst Xeneta.

Tariffs, Geopolitics Reshape Corporate Site Selection
Companies are delaying major capacity investments and prioritizing resilience over low-cost models, according to a site selection expert.
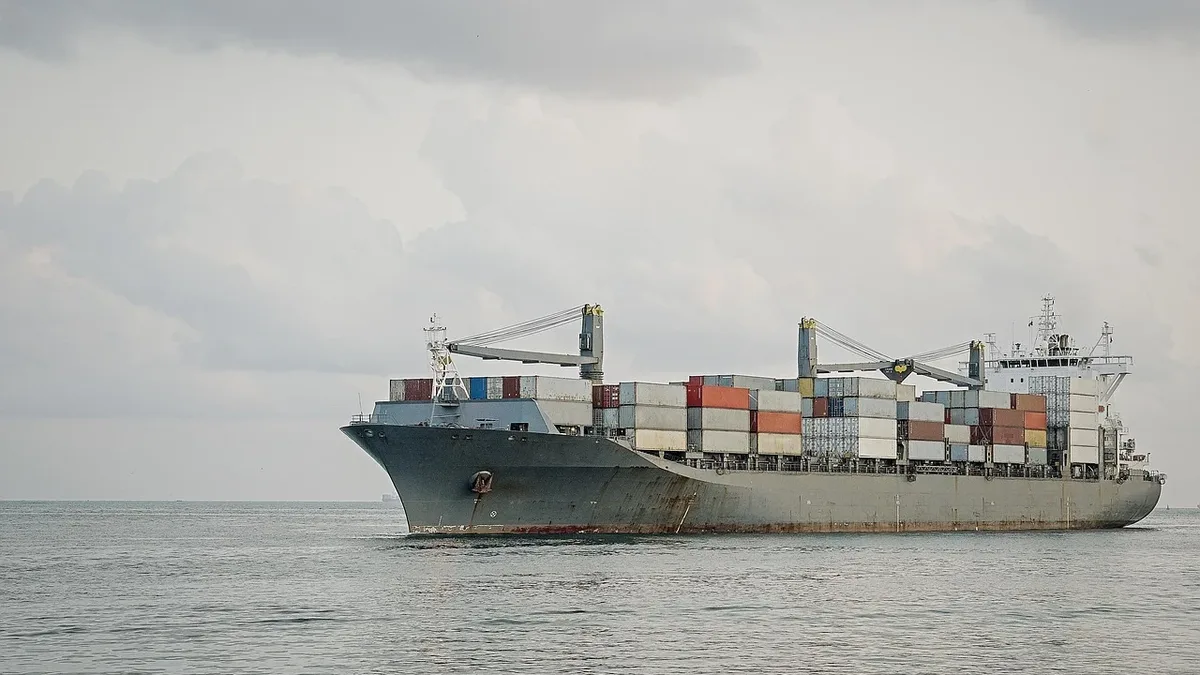
SONAR Launches Custom Insights for Shipper Consortium
FreightWaves' SONAR platform launches SCI: Custom Insights, a new tool for its Shipper Consortium members to benchmark their freight data against...
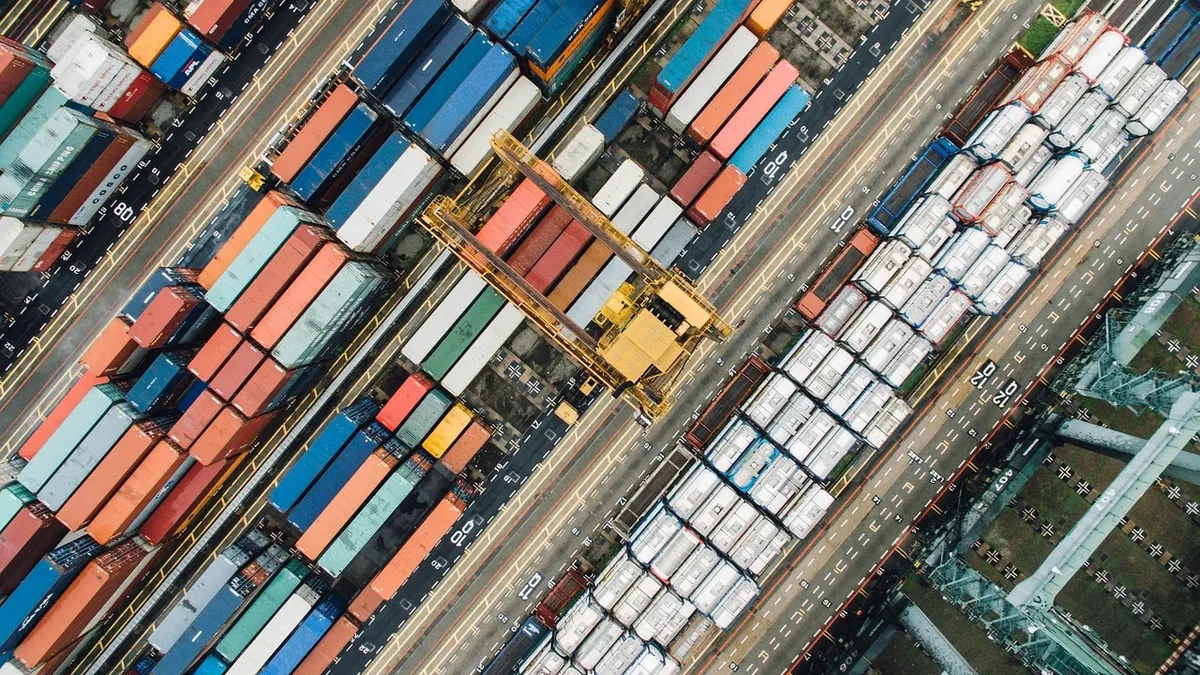
Rail container delays rise at Los Angeles-Long Beach ports
Container dwell times for rail-bound cargo increased to 6.75 days in August at the Los Angeles-Long Beach port complex, while truck-bound cargo times
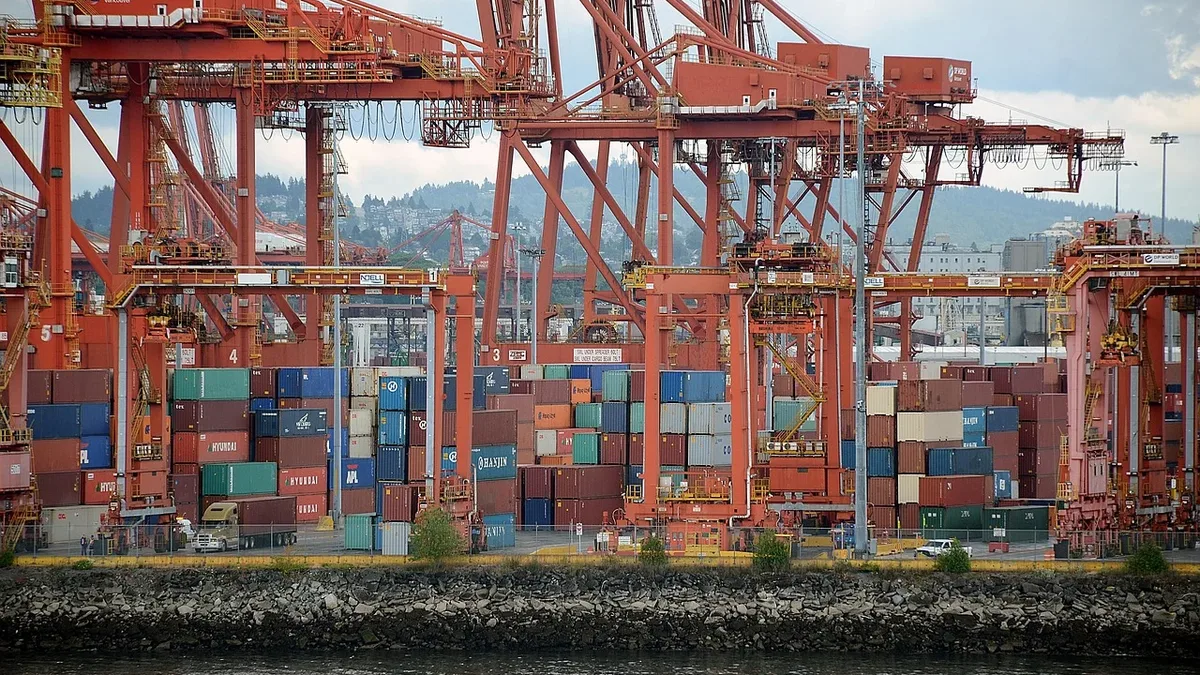
Global container volumes hit record 17.3 million TEUs
World container throughput reached a new monthly high of 17.3 million TEUs in July 2026, with year-to-date volumes up 5.1%.

AI Hardware Demand Splits Asian Air Cargo Export Market
The Asian air cargo export market is entering peak season divided, with strong AI-related demand boosting transpacific volumes while new EU e-commerce